| Issue |
EPJ Nuclear Sci. Technol.
Volume 6, 2020
INSIDER
|
|
|---|---|---|
| Article Number | 14 | |
| Number of page(s) | 6 | |
| DOI | https://doi.org/10.1051/epjn/2019054 | |
| Published online | 30 March 2020 | |
https://doi.org/10.1051/epjn/2019054
Regular Article
INSIDER UC2: the BR3 biological shield preliminary results and future work
Belgian Nuclear Research Centre SCK•CEN, Boeretang 200, 2400 Mol, Belgium
* e-mail: This email address is being protected from spambots. You need JavaScript enabled to view it.
Received:
15
May
2019
Received in final form:
24
October
2019
Accepted:
6
November
2019
Published online: 30 March 2020
Abstract
Aiming at economical optimization, the characterisation of the biological shield of the Belgian Reactor 3 is one of the three use cases intended to validate the integrated characterization methodology developed within the INSIDER project. Pre-existing data were used to define the sampling design strategy. The additional sampling and analysis program consisted of total gamma measurements at the inner surface of the biological shield (secondary data) and gamma spectrometry measurements on drill core samples (primary data). The newly acquired data is supplemented with the historical available data. The full data set currently consists of a total of 283 secondary and 379 primary data points. Preliminary calculations already provide a clear-cut representation of the three different end-stage classes: unconditional clearance, conditional clearance and radioactive waste. On the short term, the current model will be further refined and completed with proper risk evaluation. On the longer term, we envisage a global uncertainty calculation and sensitivity analysis of the entire process.
© W. Broeckx et al., published by EDP Sciences, 2020
 This is an Open Access article distributed under the terms of the Creative Commons Attribution License (https://creativecommons.org/licenses/by/4.0), which permits unrestricted use, distribution, and reproduction in any medium, provided the original work is properly cited.
1 Introduction
The EURATOM work program project INSIDER (Improved Nuclear SIte characterization for waste minimization in Decommissioning under constrained EnviRonment) aims at improving the management of contaminated materials arising from decommissioning and dismantling (D&D) operations. The methodology is based on advanced statistical processing and modelling, coupled with adapted and innovative analytical and measurement methods.
The INSIDER partners selected three case studies in order to validate the improved integrated characterisation methodology. The biological shield of the Belgian Reactor 3 (BR3) has been chosen for the second case (UC2) dealing with the decommissioning of a nuclear reactor. The reinforced high-density concrete (also known as heavy weight or barite concrete) has been exposed to neutrons during reactor operation and is therefore activated.
The main goal of the radiological characterization program is to economically optimize the biological shield dismantling strategy, using a waste-led approach. In order to reach this main goal, we established three sub objectives:
-
create a 3D specific activity distribution map;
-
quantify and localize the different end-stage volumes; and
-
economically optimize volumes in view of a waste-led approach.
Constraints are related to typical nuclear safety issues (radiation and contamination hazards) and in addition to access limitations and classical safety hazards. Due to planning and budgetary reasons, the amount of samples by core drilling was limited to 30. In situ (non-destructive) measurements are only possible on the inner or outer surface of the reactor pool walls. Moreover, acquiring results in terms of specific activities is challenging due to the activity distribution profile that depends on the depth and angle.
Section 2 of this paper describes how the method developed within the INSIDER Work Package 3 (sampling and strategy) was implemented for UC2. The preliminary results are given in Section 3. Section 4 summarizes some preliminary conclusions and reflects on the future work.
2 Method
The strategy used is being developed and will be further adjusted within Work Package 3 [1]. Following the current approach, we used the different diagrams for the data analysis and sampling design strategy. After defining the objectives and assessing the constraints, available information was analysed and checked against the objectives. This check consisted of the following steps: pre-processing, an exploratory step and the actual data analysis, and post-processing to transfer the obtained results into end-stage volumes. Apart from the available plans of the biological shield and the operational history of the reactor operation, results from neutron activation calculations and former characterization programs were available. From the different neutron activation calculation exercises performed, we noticed the following:
-
The specific activity obtained differs considerably from sample measurements for the main radionuclide present (Ba-133), while Ba is one of the main elements present in the concrete.
-
Specific activity ratios of other radionuclides to Ba-133 differ considerably between different calculations, considering different chemical compositions of the concrete (trace elements).
Radiological measurements performed in the past on drill core samples, gave a first idea on the most important radionuclides present (Ba-133, Eu-152, Co-60 and Eu-154) and the activation profiles at a few specific locations. Neutron calculations and radiological analysis showed that the potential presence of difficult to measure nuclides (i.e. H-3, C-14, Ca-41, Fe-55 and Ni-63 in the reinforcement bars) does not influence the decision-making process for defining the end-stage material volumes for conditional and unconditional clearance.
The sampling design process followed the strategy developed in Work Package 3. The samples have been taken by wet core drilling in June 2018, followed by slicing and analysing during the second half of 2018. The additional characterization results will enlarge the dataset, which will again be analysed and checked against the objectives. Deliverable D3.5 [2], covering the sampling plan for UC2, describes the process to be followed in detail.
Apart from the samples taken and analysed aiming to design the 3D specific activity distribution map, additional concrete samples at two different locations were taken and provided to the National Physical Laboratory (NPL) as part of Work Package 4 (reference materials and radiochemistry). NPL is taking care of the homogenization and distribution of sub-samples to various EU labs belonging to the INSIDER consortium in view of a benchmarking exercise for Work Package 6 (performance assessment and uncertainty evaluation. We also provided inactive concrete for the production of reference samples (Work Package 4) and organization of an interlaboratory comparison (Work Package 6).
Furthermore, five EU measurement teams have performed an in situ measurements comparison exercise within Work Package 5 (in situ measurements) in the BR3 reactor pool consisting of dose rate, total gamma and gamma spectrometry measurements at different locations in the biological shield.
3 Results
3.1 Preliminary data analysis based on pre-existing data
In a first approach, Co-60 concentration levels in the pool liner and results from a few historical drill core samples were used (Fig. 1). During the exploratory data analysis, we focused on the multivariate aspect, and the potential relation between the liner specific activities and those in the concrete. For the borehole analysis, we had Ba-133 results at all locations, but the other remaining radionuclides were not always available. Hence, we decided to fall back to a univariate problem. Since the liner data is more systematically distributed over the inner surface of the biological shield, we of course tried to account for it in this stage.
For the preliminary data analysis, we used generalized additive models. The liner Co-60 specific activity was interpolated on the inner surface of the biological shield, as a smooth function of the projected x and z coordinates, and the corresponding distance to the former fuel. For the trend modelling for the Ba-133 specific activities, we used a smooth function of the liner Co-60 specific activity and the depth within the concrete. Figure 2 illustrates the results of the preliminary data analysis. As the data on which this analysis is based is very limited, and e.g. a proper quantification of the uncertainties on the results was not even considered relevant at this stage, it was very clear that the objectives were not achieved at this point. The preliminary analysis just served the purpose of informing the sampling design.
 |
Fig. 1 Overview of the liner and borehole sample locations, corresponding to the measurement results used in the preliminary data analysis. |
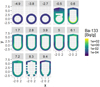 |
Fig. 2 Series of horizontal slices through the preliminary Ba-133 3D specific activity model. Each slice shows a horizontal cross section (width and length marked as x and y) of the 3D model at a certain height (z-coordinate, marked in grey fields). All coordinates are in meters. |
3.2 Sampling design and additional data gathering
After removing the liner, we performed an in situ total gamma surface mapping, consisting of 303 individual measurements using a contamination monitor (type: CoMo 300G plastic scintillator of 300 cm2 surface, manufacturer Nuvia Instruments). This roughly amounted to about one measurement per square meter. We used regular grid sampling (Fig. 3) to achieve full coverage, as the idea was to use these data as secondary information for the specific activities within the concrete, in a similar way as how the liner data was used for the preliminary data analysis.
Following the basic principles described in [1], the sampling design mainly consisted of systematic sampling (equal probability of selection/probabilistic) supplemented with judgemental selected sampling locations (specific structures such as the storage container and the refuelling channel and close to the location with the maximal activation level). In addition, the expected trend extreme locations were selected as well, and we rely on the symmetry of the activation to maximize the results with a minimum number of samples. Figure 4 shows the sampling plan.
The combination of these different sampling approaches basically ensures that:
-
We cover all the concrete elements, to reduce the risk of missing anything.
-
We include (approximately) the minimum and maximum values across the entire biological shield, but also within every element, to reduce the required amount of extrapolation during the data analysis.
-
We investigate specific features for which it is known that they deviate from the general trend.
The presence of thick reinforcement bars hampered the sampling. We choose wet drilling, implying precautions to prevent cross contamination. The cores (diameter 72 mm, length of about 90 cm down the first outer reinforcement bars) were segmented. Analysis of the segments (thickness 5–10 mm) by high-resolution gamma spectroscopy was performed in two consecutive steps. A total of 195 segments originating from the 30 drill core samples were analysed.
The dataset on which the current model is based at time of writing contains 662 data lines (Tab. 1). This contains both primary and secondary data. Of all the in situ total gamma measurements 283 are used as secondary data. The primary data consist of 184 historical measurements (based on low and high resolution gamma spectroscopy) and 195 new measurements (high resolution gamma spectroscopy). Figure 5 gives a visual representation of the current dataset.
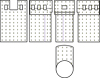 |
Fig. 3 In situ total gamma surface mapping of the inner pool (top) walls and floor (bottom). The small rectangles indicated the measurement locations. The grey lines mark the region of the storage container (also called “Poubelle”). |
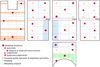 |
Fig. 4 Sampling plan for the BR3 biological shield (30 drill core samples). |
Overview of the different types and corresponding amounts of data points, at the time of writing, in the unfiltered dataset, gathered for constructing the 3D model.
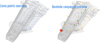 |
Fig. 5 Current dataset for the BR3 biological shield: in situ total gamma measurements (left, contamination monitor) and gamma spectroscopy on segments/samples (right, boreholes). |
3.3 Data analysis new data included
At present, further data analysis and checking of the objectives is ongoing. Figure 6 shows the example of a horizontal slice of the BR3 biological shield indicating the forecasted class: unconditional clearance, conditional clearance or radioactive waste. This kind of output is indispensable for the colleagues in charge of developing the dismantling strategy. Volume estimations are not yet reported in this stage. In the first place, result calculation needs further development and refinement.
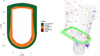 |
Fig. 6 Example of a horizontal slice of the BR3 biological shield indicating the forecasted classes and the corresponding 3D location (left; data for z = 0.5 m, right; existing primary data points are shown in blue, new primary data points in red and the location of the slice at a reference height of 0.5 m is marked in green). |
4 Conclusions and future work
The strategy developed within Work Package 3 of the INSIDER project is currently being applied on the characterization of the biological shield of the BR3 reactor. The current results show that the process, methodology and tools used are very powerful in combining results of various types of data, developing sampling design, performing data analysis and treatment and providing results representation.
The current result representation needs further refinement. Some examples:
-
In the sampling plan, we tried to include the maximum value. Due to the presence of an activated reinforcement ring at the level where the maximum specific activity in the concrete was expected, it was not possible to sample this area. Moreover, the results of the in situ gamma spectroscopy measurements in this area might be influenced by this component. In the present results representation, the specific activity for this area has been extrapolated. Additional measurement data will be collected after removal of the ring.
-
The presence of a small contamination in one corner on the pool floor, close to the former storage container, was reflected in a part of the total gamma in situ measurements. The contamination needs to be removed and the total gamma measurements in this area need to be repeated.
-
Current values shown are the best estimates. Uncertainty calculations and the use of confidence levels are not yet implemented. On the other hand, an averaging out over 1 ton of material could be taken into account in order to minimize the risk.
-
In order to evaluate the risk we will perform cross validation calculations.
Towards the end of the INSIDER project, we envisage a global uncertainty calculation and sensitivity analysis of the entire process from initial characterization towards the assessment against objectives (Work Package 6). The results of the in situ and laboratory intercomparison and benchmarking exercises (see Sect. 2) could serve as important input.
Return of experience from the BR3 case will, together with the other two use cases, lead to a guide on the data analysis and sampling design strategy that has been developed within Work Package 3 of the INSIDER project.
Acknowledgments
INSIDER is a EU Horizon 2020 project and received funding from the Euratom Research and Training Programme 2014-2018 under grant agreement No 755554.
Author contribution statement
S. Boden and B. Rogiers developed the described strategy and performed the data analysis. B. Rogiers performed most of the computational data analysis. R. Vandyck, G. Verstrepen and W. Broeckx organized and performed the measurement and sampling campaigns, while N. Mangelschots managed the data gathered from the measurement campaigns. All authors discussed the results and provided feedback. S. Boden and W. Broeckx wrote the manuscript together with B. Rogiers.
References
- B. Rogiers, S. Boden, N. Pérot, Y. Desnoyers, O. Sevbo, O. Nitzsche, Improved nulcear site characterization for waste minimization in decommissioning and dismantling operations under constraint environment. INSIDER WP3–Sampling strategy, Report on the sampling strategy development. Deliverable D3.2, H2020 INSIDER [Google Scholar]
- S. Boden, B. Rogiers, G. Verstrepen, N. Mangelschots, W. Broeckx, Improved nuclear site characterization for waste minimization in decommissioning and dismantling operations under constraint environment. INSIDER WP3–Sampling plan for use case 2 BR3 bioshield. Deliverable D3.5, H2020 INSIDER [Google Scholar]
Cite this article as: Wouter Broeckx, Bart Rogiers, Nico Mangelschots, Ronny Vandyck, Greet Verstrepen, Sven Boden, INSIDER UC2: the BR3 biological shield preliminary results and future work, EPJ Nuclear Sci. Technol. 6, 14 (2020)
All Tables
Overview of the different types and corresponding amounts of data points, at the time of writing, in the unfiltered dataset, gathered for constructing the 3D model.
All Figures
|
Fig. 1 Overview of the liner and borehole sample locations, corresponding to the measurement results used in the preliminary data analysis. |
| In the text | |
|
Fig. 2 Series of horizontal slices through the preliminary Ba-133 3D specific activity model. Each slice shows a horizontal cross section (width and length marked as x and y) of the 3D model at a certain height (z-coordinate, marked in grey fields). All coordinates are in meters. |
| In the text | |
|
Fig. 3 In situ total gamma surface mapping of the inner pool (top) walls and floor (bottom). The small rectangles indicated the measurement locations. The grey lines mark the region of the storage container (also called “Poubelle”). |
| In the text | |
|
Fig. 4 Sampling plan for the BR3 biological shield (30 drill core samples). |
| In the text | |
|
Fig. 5 Current dataset for the BR3 biological shield: in situ total gamma measurements (left, contamination monitor) and gamma spectroscopy on segments/samples (right, boreholes). |
| In the text | |
|
Fig. 6 Example of a horizontal slice of the BR3 biological shield indicating the forecasted classes and the corresponding 3D location (left; data for z = 0.5 m, right; existing primary data points are shown in blue, new primary data points in red and the location of the slice at a reference height of 0.5 m is marked in green). |
| In the text | |
Current usage metrics show cumulative count of Article Views (full-text article views including HTML views, PDF and ePub downloads, according to the available data) and Abstracts Views on Vision4Press platform.
Data correspond to usage on the plateform after 2015. The current usage metrics is available 48-96 hours after online publication and is updated daily on week days.
Initial download of the metrics may take a while.