Fig. 3.
Download original image
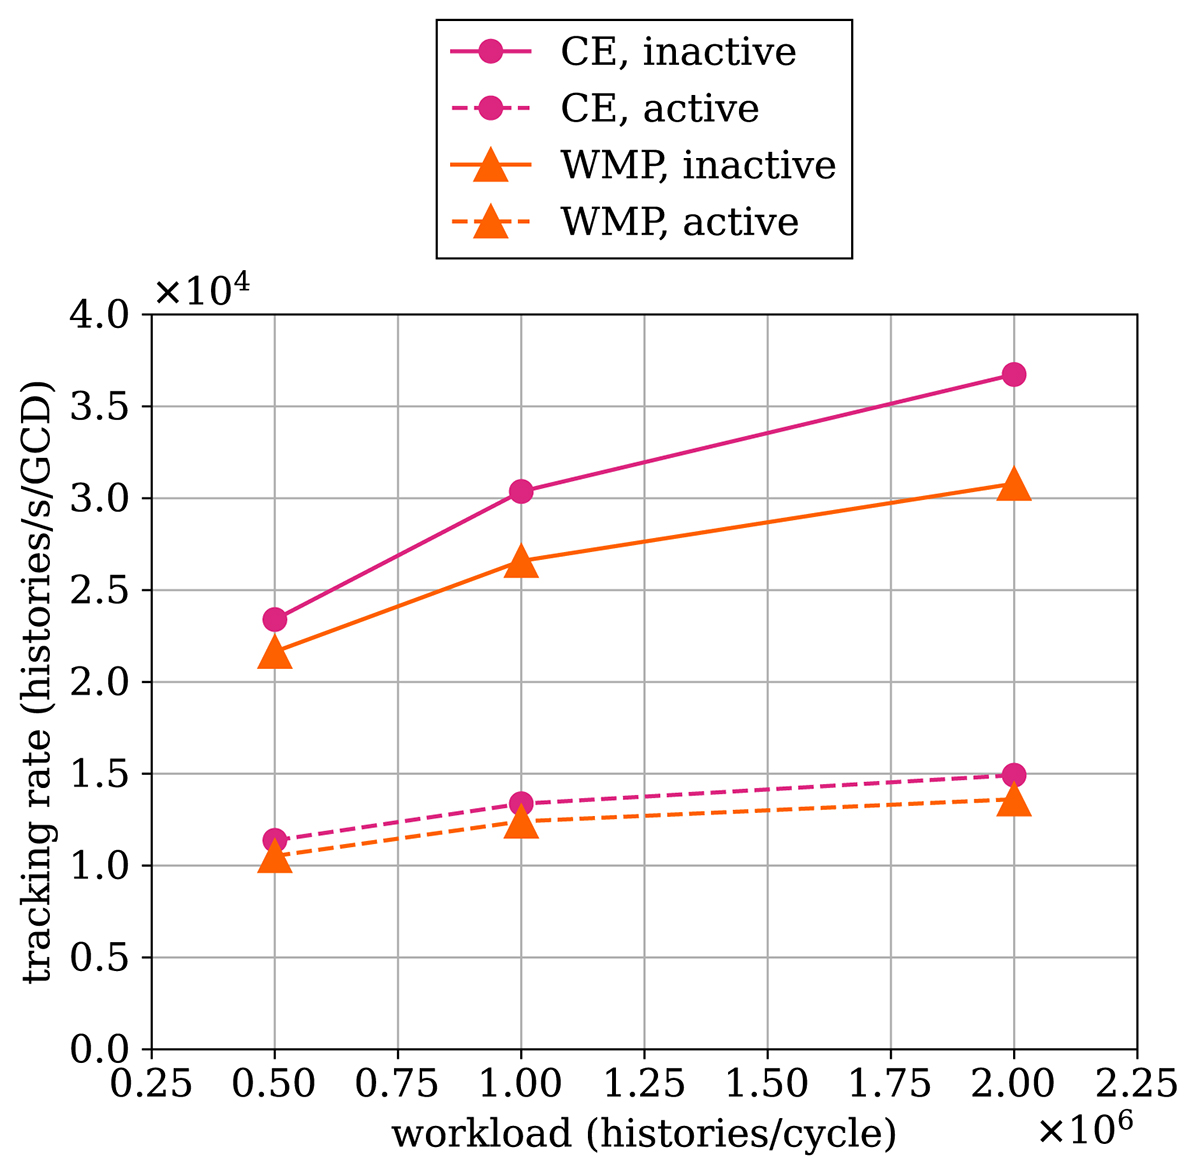
GPU tracking rate comparison between simulations using the WMP method vs. CE data for the depleted core NuScale SMR problem on a single node of Summit for active and inactive cycles. Tracking rates are per GPU GCD. Total flux and five reaction rates were tallied on a 60 × 60 × 10 Cartesian mesh during active cycles.
Current usage metrics show cumulative count of Article Views (full-text article views including HTML views, PDF and ePub downloads, according to the available data) and Abstracts Views on Vision4Press platform.
Data correspond to usage on the plateform after 2015. The current usage metrics is available 48-96 hours after online publication and is updated daily on week days.
Initial download of the metrics may take a while.