Open Access
Fig. 7.
Download original image
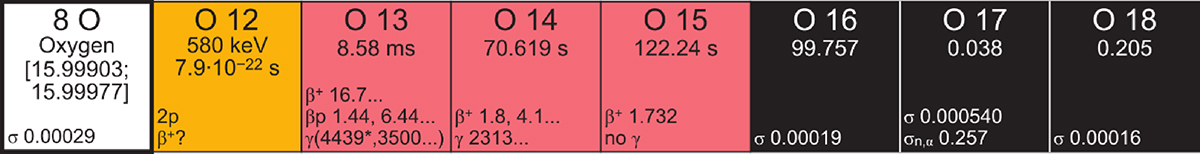
From the 9th edition in 2015, the element boxes show a range of atomic weights to show the natural isotopic variability. The source of this data is the actual IUPAC Table of Isotopic Abundances.
Current usage metrics show cumulative count of Article Views (full-text article views including HTML views, PDF and ePub downloads, according to the available data) and Abstracts Views on Vision4Press platform.
Data correspond to usage on the plateform after 2015. The current usage metrics is available 48-96 hours after online publication and is updated daily on week days.
Initial download of the metrics may take a while.