Fig. 64.
Download original image
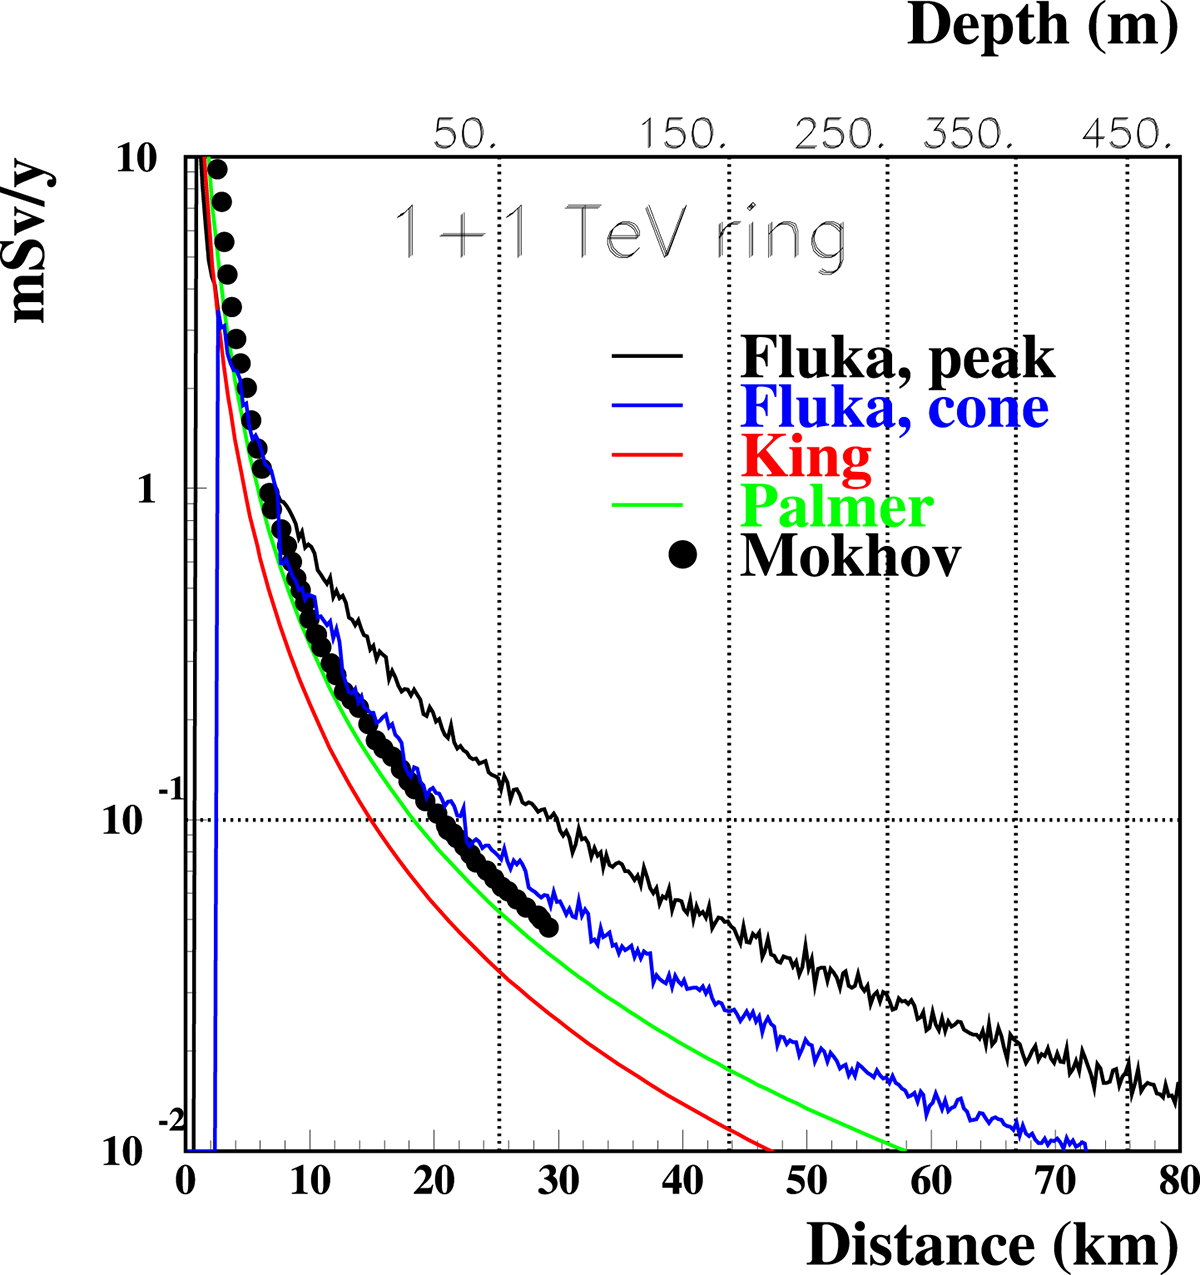
H*(10) from neutrino interaction products as a function of distance from the muon collider, or, equivalently, depth of the muon collider (top x-axis). Normalized to 1.2 × 10²¹ μ decays per year. The horizontal line draws the limit for population. Muon beams at 1 TeV (2 TeV centre of mass energy), radiation from the ensemble of the ring. FLUKA results labelled “peak” are averaged over 1 m in the vertical direction. FLUKA results labelled “cone” are averaged over 1/γ to be compatible with results in [319] (black symbols). The analytical approximations as in [320, 321] (red and green lines) are displayed.
Current usage metrics show cumulative count of Article Views (full-text article views including HTML views, PDF and ePub downloads, according to the available data) and Abstracts Views on Vision4Press platform.
Data correspond to usage on the plateform after 2015. The current usage metrics is available 48-96 hours after online publication and is updated daily on week days.
Initial download of the metrics may take a while.