Fig. 55.
Download original image
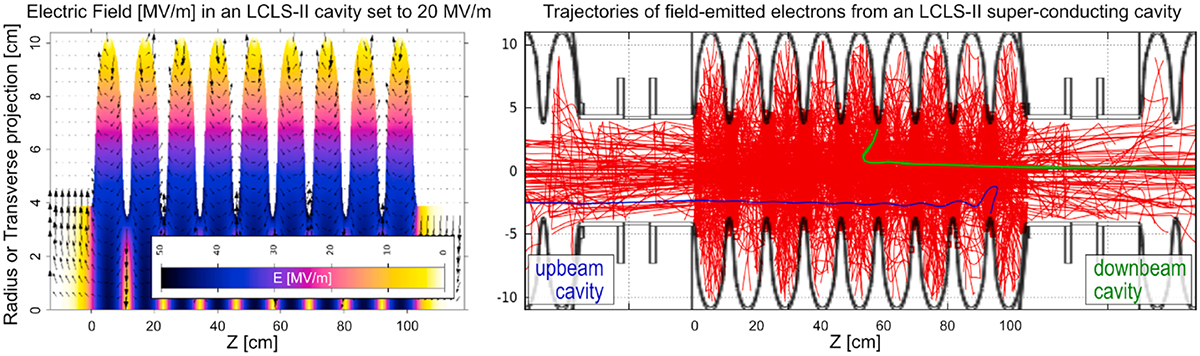
Left: FLAIR (the FLUKA graphical interface [223]) representation of the 1.3 GHz electric field in LCLS-II cavities at SLAC (magnetic field alternates at 90°), as coded in FLUKA for simulation of field-emission and/or transport of charged particles. Right: trajectories of field-emitted electrons from the inner surface of an LCLS-II Nb cavity, and propagation to neighboring cavities. The green track represents an electron that is eventually extracted to the down beam end of the 8-cavity cryomodule, while the blue track will be part of the backwards “captured current”.
Current usage metrics show cumulative count of Article Views (full-text article views including HTML views, PDF and ePub downloads, according to the available data) and Abstracts Views on Vision4Press platform.
Data correspond to usage on the plateform after 2015. The current usage metrics is available 48-96 hours after online publication and is updated daily on week days.
Initial download of the metrics may take a while.