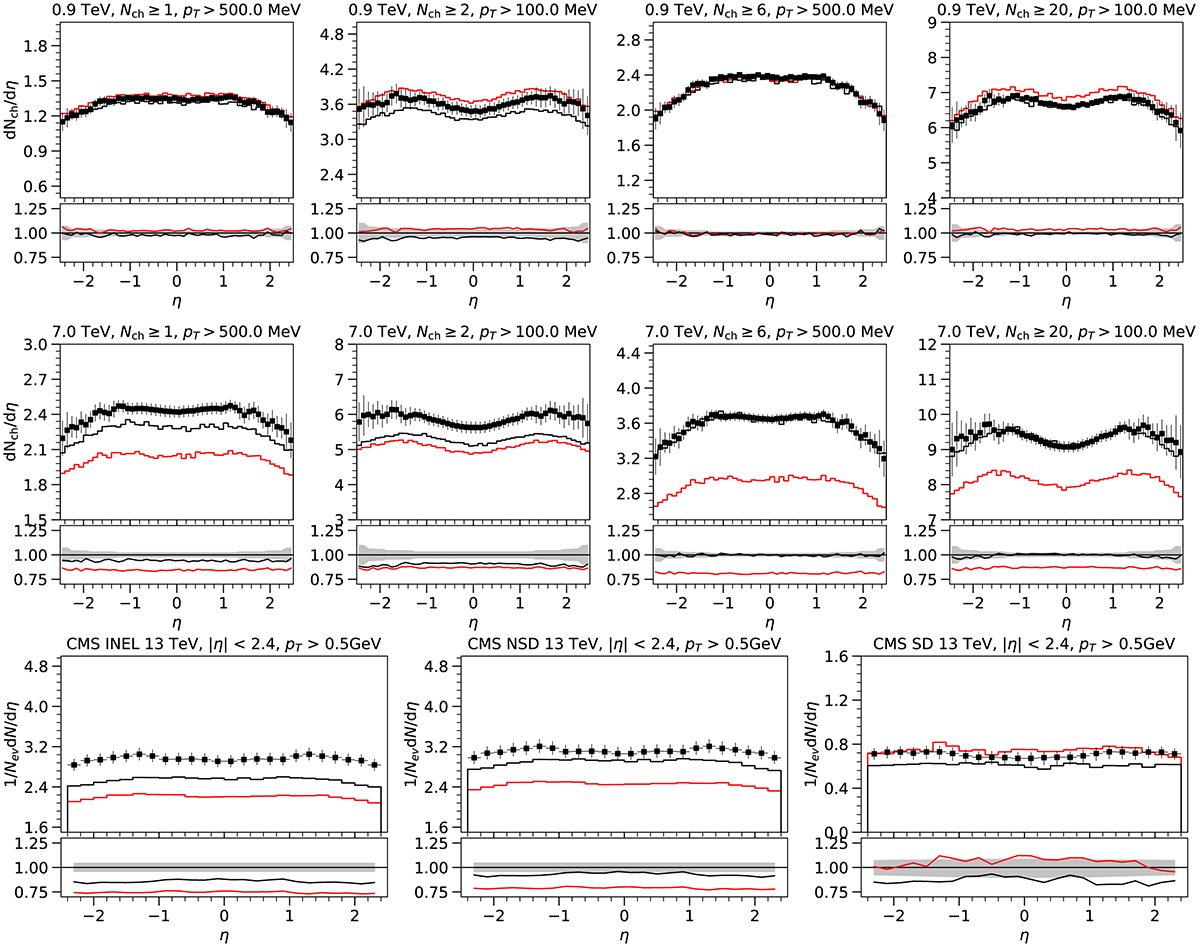
Fig. 28.
Download original image
Upper and middle panels: comparison with ATLAS minimum bias data [163], red curves DPMJET-III-3.0.6 and DPMJET-III-19.3 in black. Lower three panels: CMS 13 TeV data from inelastic-, non-single-diffractive-, and single-diffractive-enriched event selections. Note that DPMJET was not tuned to the 13 TeV. The phase-space intervals are indicated above each panel.
Current usage metrics show cumulative count of Article Views (full-text article views including HTML views, PDF and ePub downloads, according to the available data) and Abstracts Views on Vision4Press platform.
Data correspond to usage on the plateform after 2015. The current usage metrics is available 48-96 hours after online publication and is updated daily on week days.
Initial download of the metrics may take a while.