Fig. 12.
Download original image
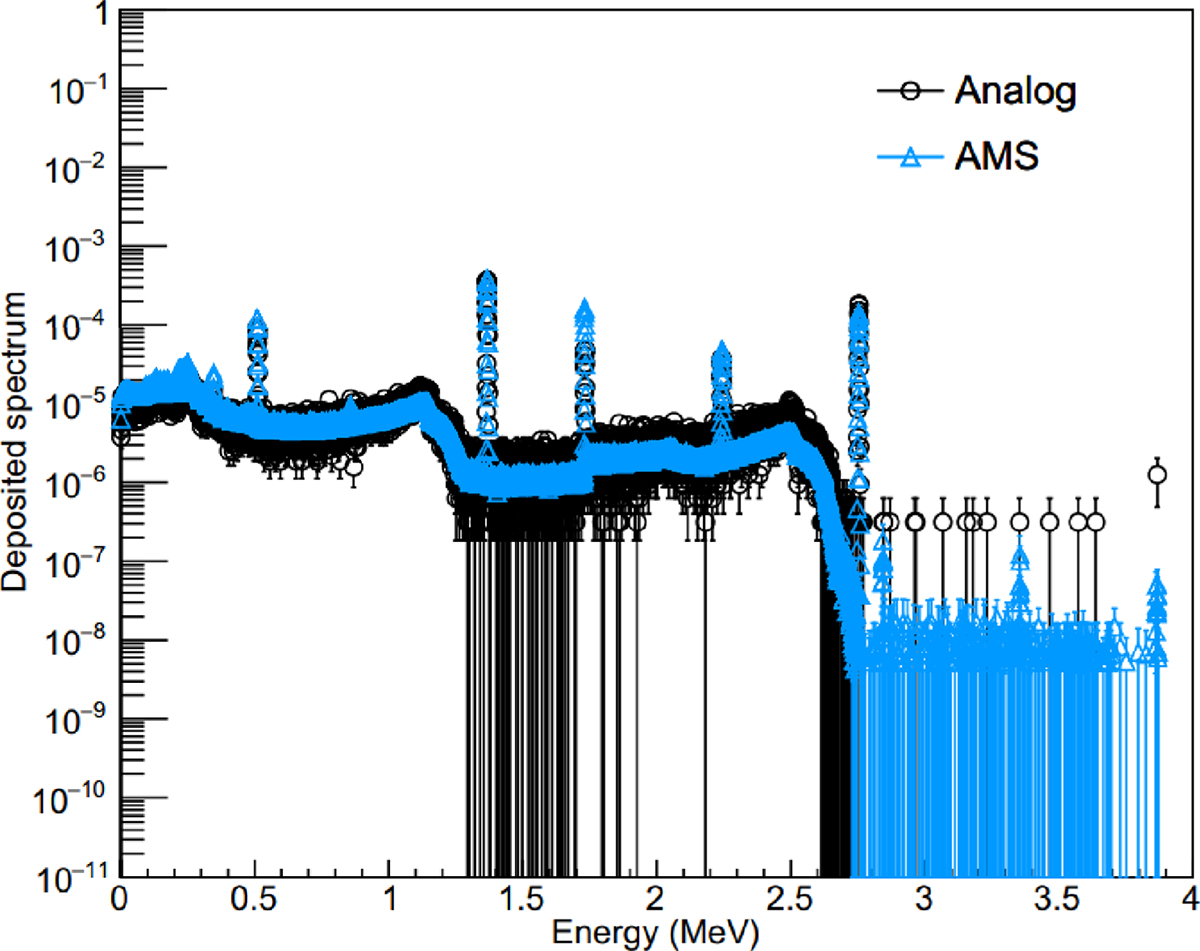
Application of the AMS variance-reduction method to the calculation of the deposited spectrum in a HPGe detector, for a benchmark configuration. Comparison between simulations with (blue) and without (black) AMS. Figure taken from reference [76]. (This figure is subject to copyright protection and is not covered by Creatice Commons License. EDP Sciences, 2017).
Current usage metrics show cumulative count of Article Views (full-text article views including HTML views, PDF and ePub downloads, according to the available data) and Abstracts Views on Vision4Press platform.
Data correspond to usage on the plateform after 2015. The current usage metrics is available 48-96 hours after online publication and is updated daily on week days.
Initial download of the metrics may take a while.