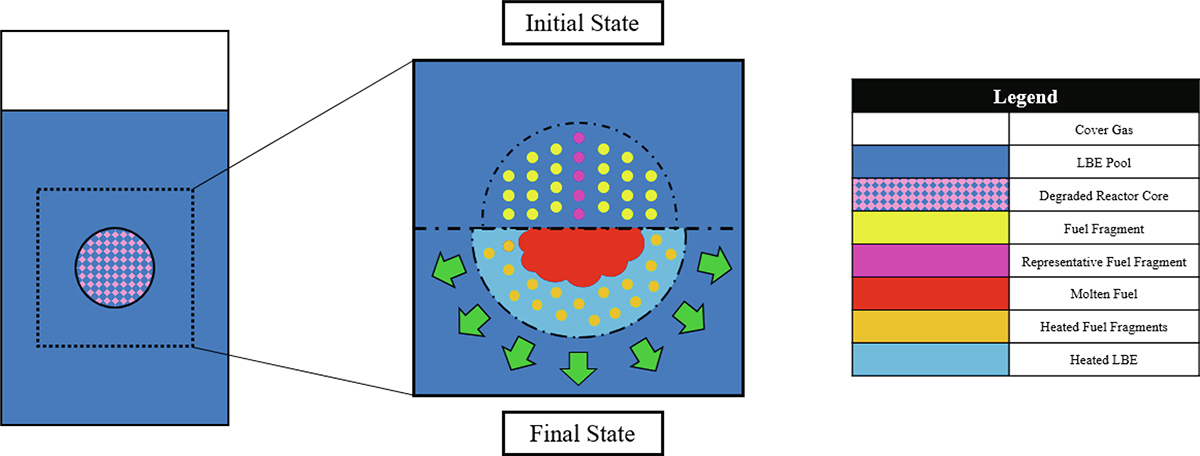
Fig. 1.
Download original image
Simplified overview of the reactor pool and the computational domain. The upper section of the computational domain represents the state of the core at the beginning of the transient, whereas the lower section represents the state of the core at the end of the simulation.
Current usage metrics show cumulative count of Article Views (full-text article views including HTML views, PDF and ePub downloads, according to the available data) and Abstracts Views on Vision4Press platform.
Data correspond to usage on the plateform after 2015. The current usage metrics is available 48-96 hours after online publication and is updated daily on week days.
Initial download of the metrics may take a while.