Fig. 8

Download original image
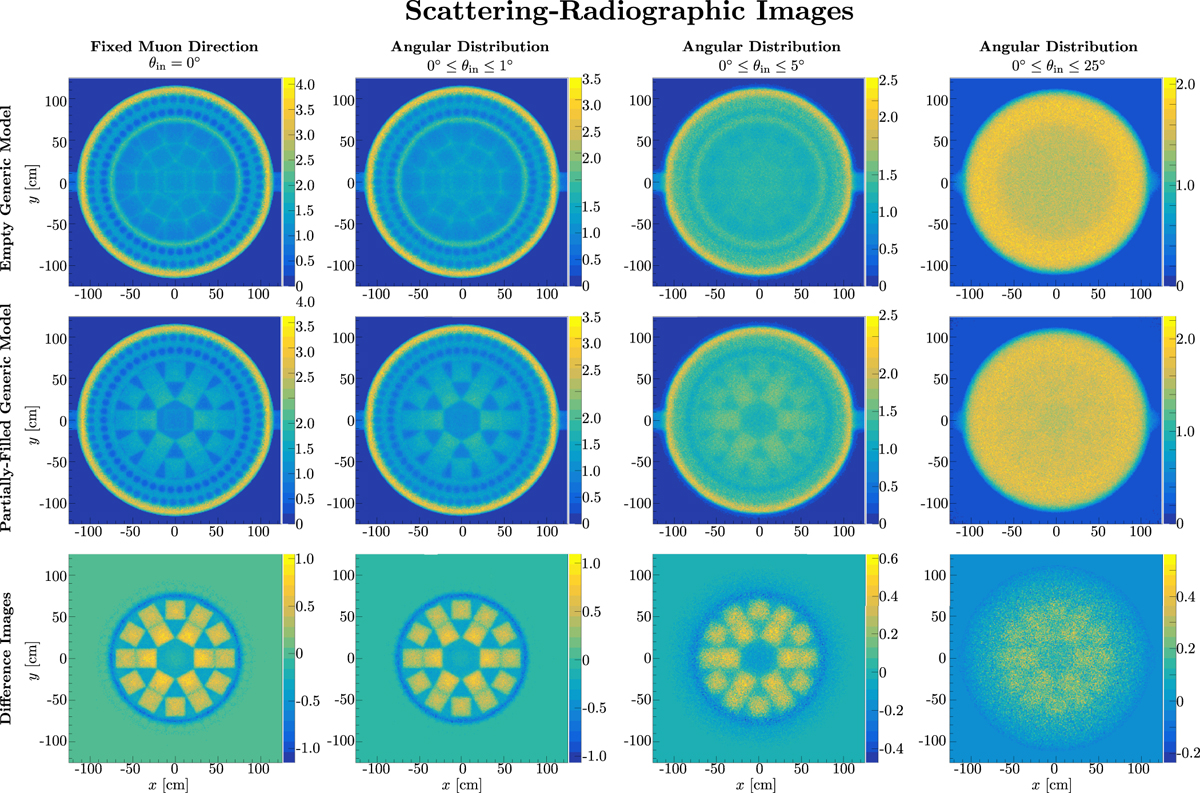
The figures in the two upper rows show scattering-radiographic images of longitudinal scans of a.) an empty generic model (top row) as well as b.) a generic model filled with 18 out of 19 possible fuel assemblies (middle row) where the central fuel compartment remained empty. The color code represents for each pixel the median of the associated scattering-angle distribution. The bottom row shows corresponding difference images, b − a. Different assumptions on the initial muon directions are considered from left to right and range from a fixed initial muon direction with θin = 0° (left) to an angular distribution with respect to θin of 0° to 25° (right). The x- and y-coordinates refer to the muon positions at the exit of the incoming detector.
Current usage metrics show cumulative count of Article Views (full-text article views including HTML views, PDF and ePub downloads, according to the available data) and Abstracts Views on Vision4Press platform.
Data correspond to usage on the plateform after 2015. The current usage metrics is available 48-96 hours after online publication and is updated daily on week days.
Initial download of the metrics may take a while.


