Fig. 5

Download original image
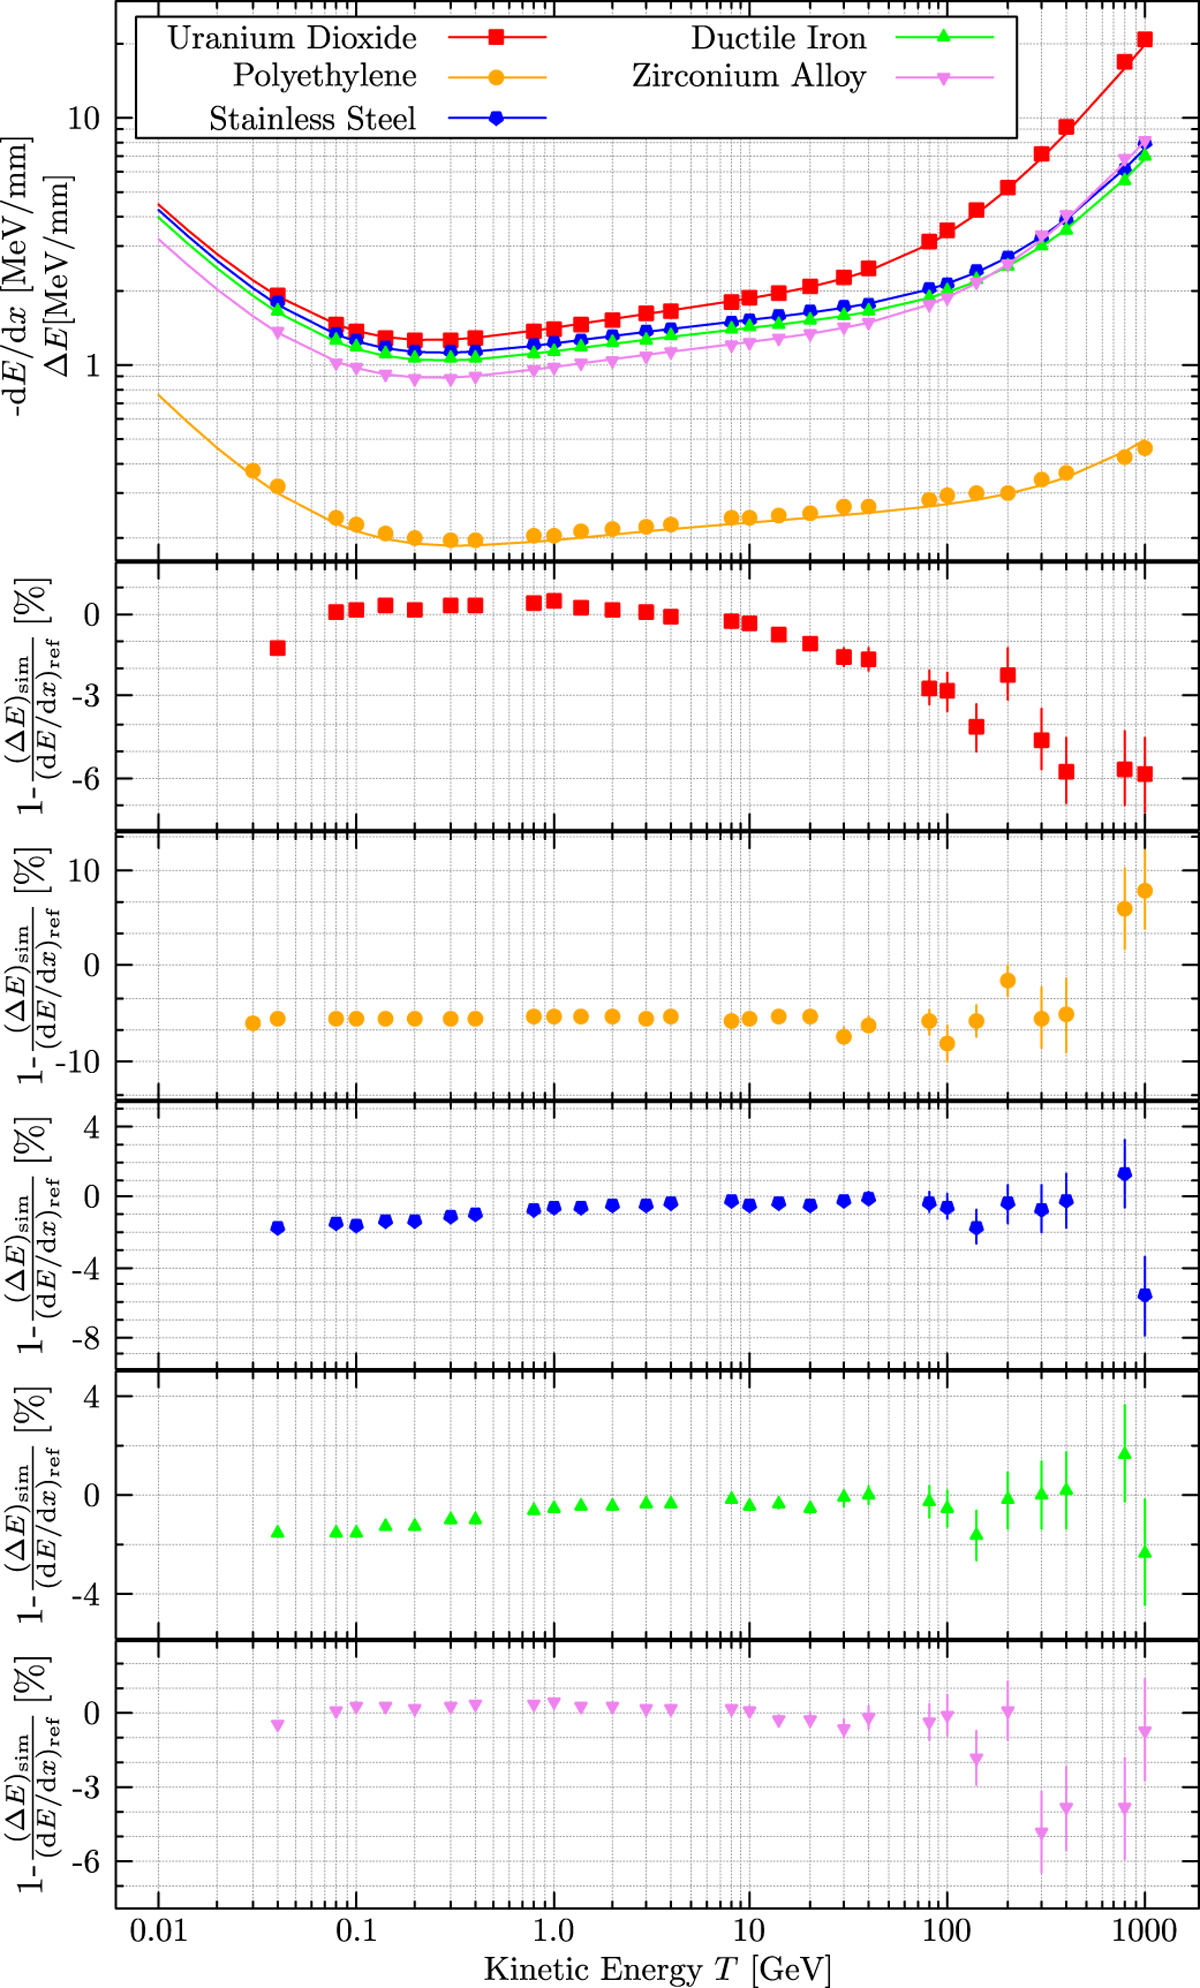
Comparison of simulated mean energy losses ΔE per distance and mean differential energy losses dE/dx (both in [MeV/mm]) of muons in various target materials. The top figure shows simulated mean energy losses (symbols) and compares them to tabulated reference values (solid lines). The red curve (boxes) shows the results for uranium dioxide, theorange curve (circles) corresponds to polyethylene, the blue curve (pentagons) corresponds to stainless steel, the green curve (up-pointing triangles) corresponds to ductile iron and the violet curve (down-pointing triangles) corresponds to zirconium alloy. The lower five figures show for each material the relative deviations between simulated energy loss per mm and tabulated mean stopping power values.
Current usage metrics show cumulative count of Article Views (full-text article views including HTML views, PDF and ePub downloads, according to the available data) and Abstracts Views on Vision4Press platform.
Data correspond to usage on the plateform after 2015. The current usage metrics is available 48-96 hours after online publication and is updated daily on week days.
Initial download of the metrics may take a while.


