Fig. 10

Download original image
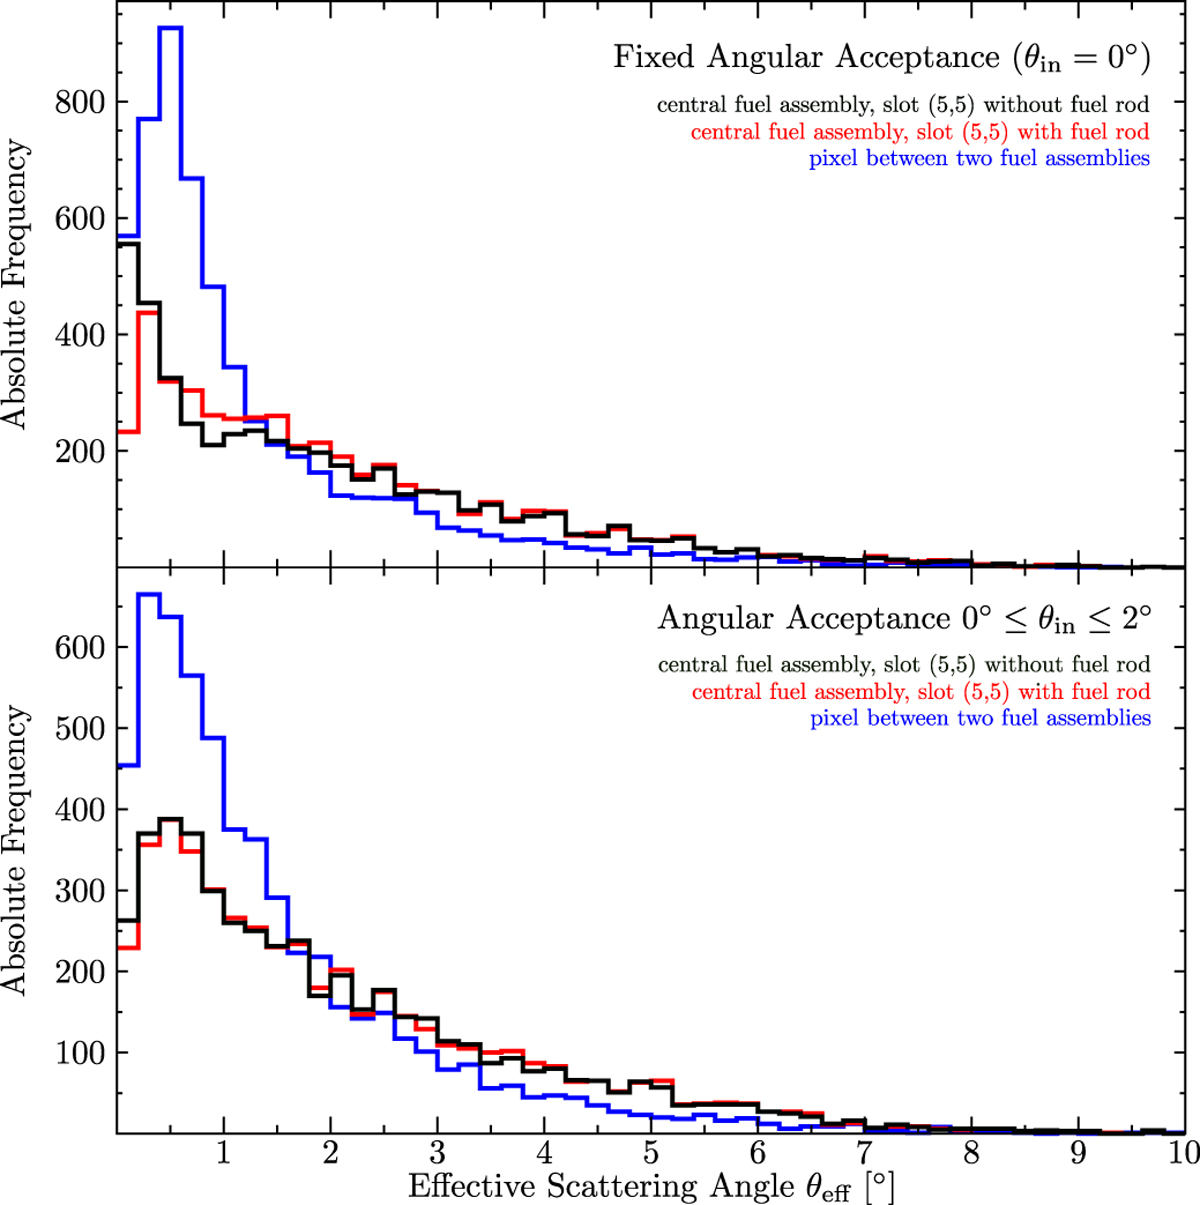
Absolute frequency distributions of the effective scattering angle θeff for different pixels and different angular acceptances. The red and black curves correspond to the pixel of the slot position (5,5) of the central fuel assembly. The black curve represents the case where this particular slot position is empty while the red curve corresponds to the case where the slot position is filled with a fuel rod. The blue curve corresponds to a pixel between two neighbouring fuel assemblies. The top figure shows results for a fixed angular acceptance (θin = 0°) while the bottom figure shows results for an angular acceptance of 0° ≤ θin ≤ 2°. All distributions correspond to simulations with 108 events.
Current usage metrics show cumulative count of Article Views (full-text article views including HTML views, PDF and ePub downloads, according to the available data) and Abstracts Views on Vision4Press platform.
Data correspond to usage on the plateform after 2015. The current usage metrics is available 48-96 hours after online publication and is updated daily on week days.
Initial download of the metrics may take a while.


