Open Access
Fig. 17
Download original image
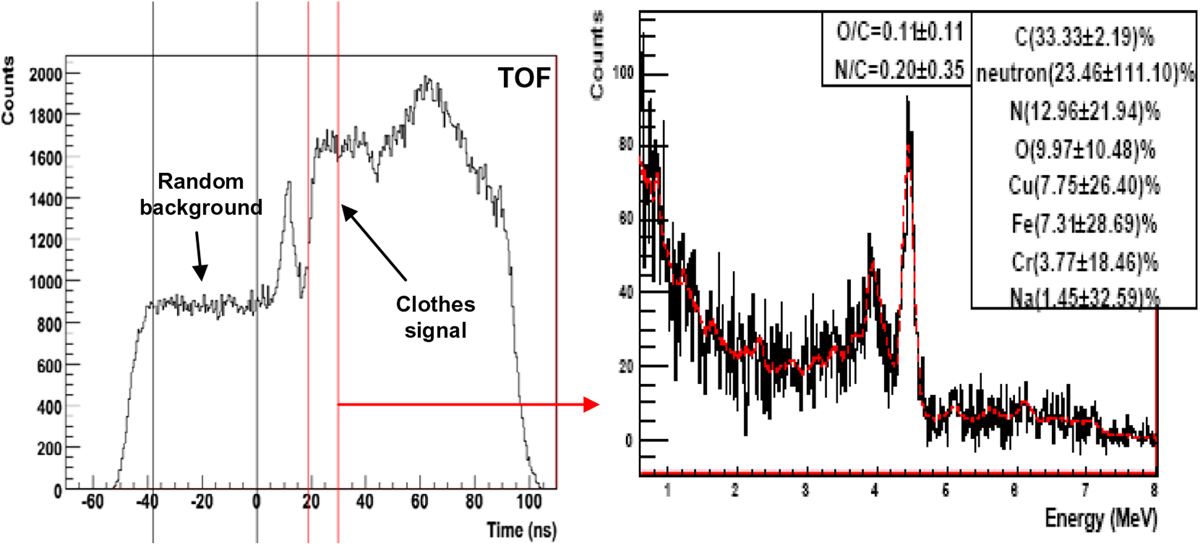
TOF (left) and energy spectra (right, for the TOF selection between the red lines) of a truck transporting clothes. The random background has been subtracted and the red line in the energy spectrum corresponds to the fit with a linear combination of pure element spectra.
Current usage metrics show cumulative count of Article Views (full-text article views including HTML views, PDF and ePub downloads, according to the available data) and Abstracts Views on Vision4Press platform.
Data correspond to usage on the plateform after 2015. The current usage metrics is available 48-96 hours after online publication and is updated daily on week days.
Initial download of the metrics may take a while.