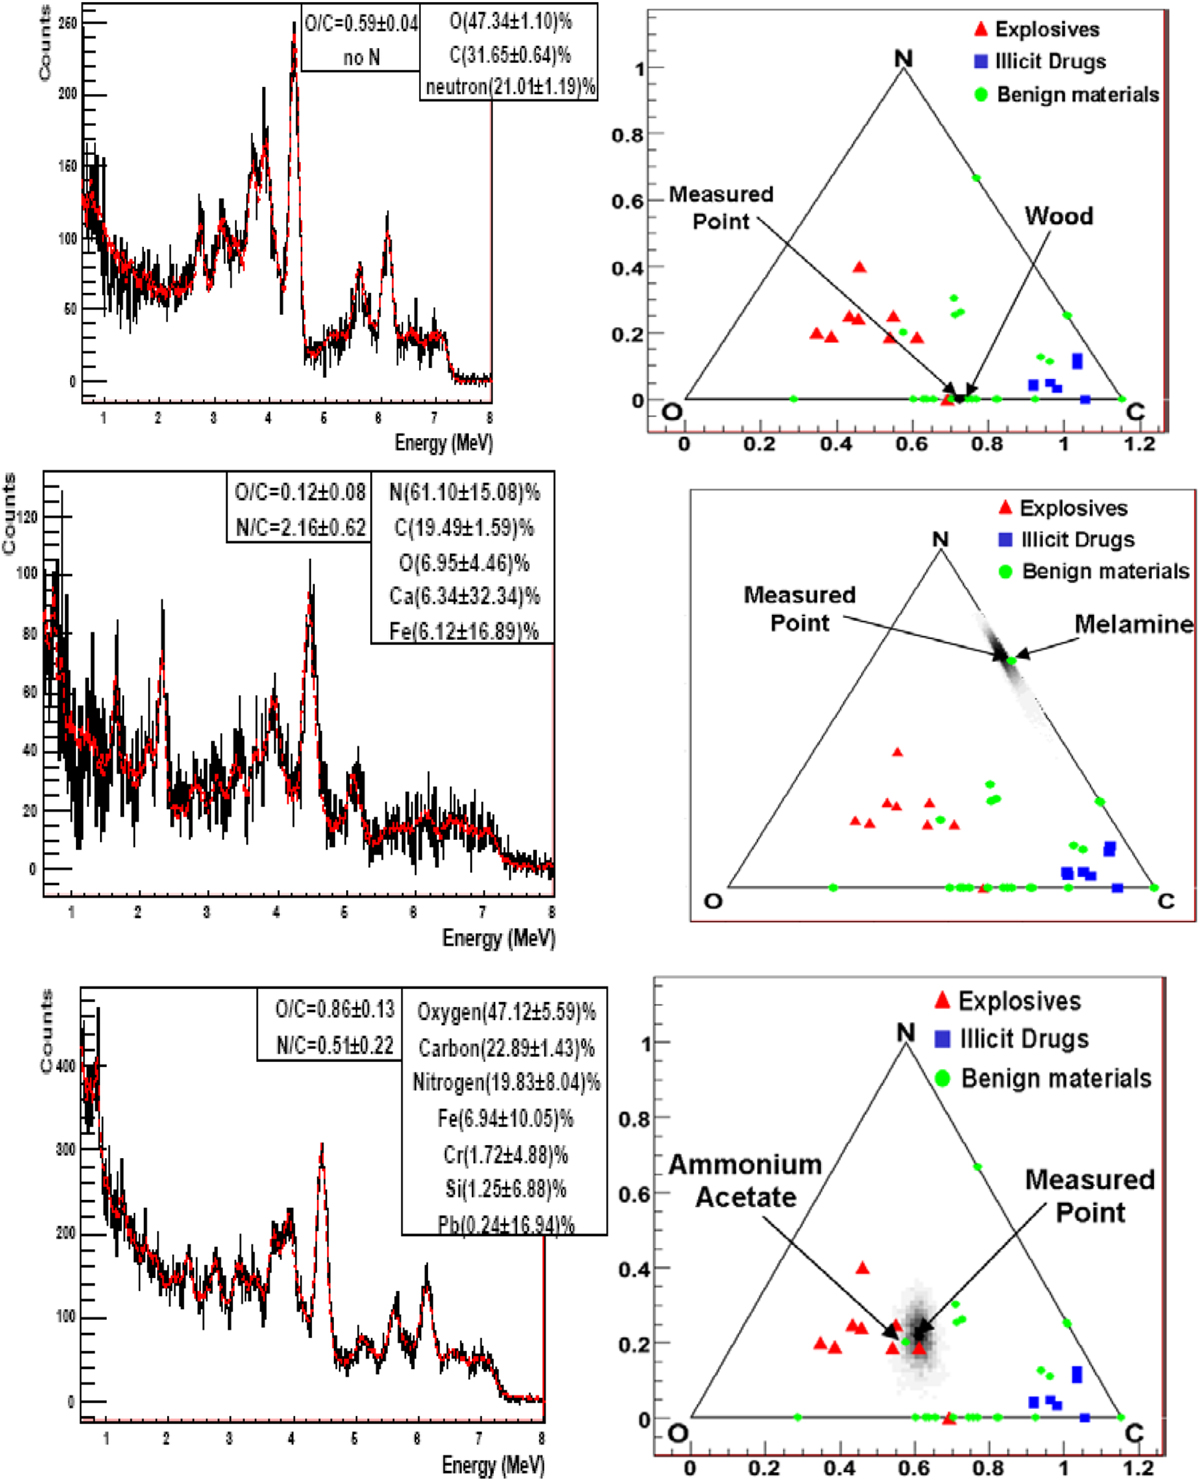
Fig. 12

Download original image
Gamma-ray spectra and triangle representation of the C, N, and O chemical proportions for bare samples of wood (on top), melamine (in the middle), and ammonium acetate (below). The dashed red lines in the energy spectra correspond to the fit with a linear combination of the pure element spectra. The unfolded count fractions are given in % and the reported O/C and N/C are the chemical ratios obtained with the conversion factors calculated for these measurement setups.
Current usage metrics show cumulative count of Article Views (full-text article views including HTML views, PDF and ePub downloads, according to the available data) and Abstracts Views on Vision4Press platform.
Data correspond to usage on the plateform after 2015. The current usage metrics is available 48-96 hours after online publication and is updated daily on week days.
Initial download of the metrics may take a while.


