| Issue |
EPJ Nuclear Sci. Technol.
Volume 3, 2017
|
|
|---|---|---|
| Article Number | 32 | |
| Number of page(s) | 8 | |
| DOI | https://doi.org/10.1051/epjn/2017024 | |
| Published online | 22 November 2017 | |
https://doi.org/10.1051/epjn/2017024
Regular Article
Evolution of the collective radiation dose of nuclear reactors from the 2nd through to the 3rd generation and 4th generation sodium-cooled fast reactors
1
CEA, DEN,
91191
Gif-sur-Yvette, France
2
CEA, DEN, DMRC, SA2I,
30207
Bagnols-sur-Cèze, France
* e-mail: This email address is being protected from spambots. You need JavaScript enabled to view it.
Received:
30
January
2017
Received in final form:
23
May
2017
Accepted:
26
September
2017
Published online: 22 November 2017
Abstract
During the operation of a nuclear reactor, the external individual doses received by the personnel are measured and recorded, in conformity with the regulations in force. The sum of these measurements enables an evaluation of the annual collective dose expressed in man·Sv/year. This information is a useful tool when comparing the different design types and reactors. This article discusses the evolution of the collective dose for several types of reactors, mainly based on publications from the NEA and the IAEA.
The spread of good practices (optimization of working conditions and of the organization, sharing of lessons learned, etc.) and ongoing improvements in reactor design have meant that over time, the doses of various origins received by the personnel have decreased.
In the case of sodium-cooled fast reactors (SFRs), the compilation and summarizing of various documentary resources has enabled them to be situated and compared to other types of reactors of the second and third generations (respectively pressurized water reactors in operation and EPR under construction). From these results, it can be seen that the doses received during the operation of SFR are significantly lower for this type of reactor.
© J. Guidez and A. Saturnin, published by EDP Sciences, 2017
 This is an Open Access article distributed under the terms of the Creative Commons Attribution License (http://creativecommons.org/licenses/by/4.0), which permits unrestricted use, distribution, and reproduction in any medium, provided the original work is properly cited.
1 Introduction
Since 1992, the Information System on Occupational Exposure (ISOE) program, supported by the OECD/NEA and the IAEA, has collected and analyzed data concerning the radiological exposure of personnel working in nuclear power plants. The electricity producers and national regulatory authorities of around 30 countries participate in this network, which includes 90% of the commercial nuclear power reactors in the world (400 operating reactors and 80 shutdown reactors). Each year, the ISOE draws up lists of the collective dose for the different types of reactors [1,2].
Nevertheless, the dose rates for sodium-cooled fast reactors (SFRs), as well as for other facilities in the fuel cycle, have not been assessed by the ISOE program. At Marcoule, the CEA has gathered information published in the literature in order to develop a specific database giving additional information. This article is therefore based on these two sources.
2 Causes of irradiation during the operation of a reactor
During reactor operation, several factors contribute to personnel exposure, with external irradiation due to gamma rays being the main contributor.
For pressurized water reactors (PWRs), virtually all the doses absorbed come from the activation of corrosion products coming from the main alloys found in the primary and auxiliary circuits [3]. More than 90% of the doses absorbed come from surface contamination caused by activated corrosion products (see Fig. 1).
Fission product contamination of the primary circuit may come from a rupture or from a leak tightness defect in certain fuel pins. Fission products like krypton, xenon, iodine or cesium are then released and can be found, depending on the case, in gaseous phase or in the coolant.
In the case of boiling water reactors (BWRs), an additional source of external exposure must be considered for personnel working in the turbine hall. This is 16N, an activation product with an energetic gamma ray that is carried by the primary circuit to the turbines.
Furthermore radioactive gases, like tritium, may also be spread into the circuits.
In certain zones of the reactor, the presence of these radionuclides can lead to an increase in the atmospheric radioactivity and may mean temporary access bans when the unit is in operation.
During a production period, the personnel exposed to doses are mainly those involved in maintenance operations. The activities causing the highest dose rates usually take place during unit shutdown. According to the ISOE [1] and the IRSN [5], in PWRs about 80% of the annual radiation exposure can be attributed to maintenance operations carried out during unit shutdown (see Fig. 2). For water-cooled reactors, this may for example include vessel opening operations, equipment handling, maintenance or repair work on contaminated or activated equipment, filter changes, etc. Finally, the balance sheets published show that the dose vary depending on the type of unit shutdown, with the collective dose distribution being, in ascending order: refueling shutdown (“RS”), inspections (“I”) or 10-yearly inspections (see Fig. 3).
For SFRs, the causes of irradiation during operation are different. For example, activated corrosion products remain confined in the primary circuit and unit shutdown does not mean the vessel or its circuits are opened.
 |
Fig. 1 Main contributors to doses coming from surface contamination by activated corrosion products [4]. |
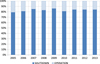 |
Fig. 2 Distribution of the French reactor fleet collective doses for shutdown and operational phases [1]. |
3 Collective doses for the main types of reactors (not including SFR)
The evolution of annual collective doses for the different types of reactor is shown in Figure 4. This figure, taken from the ISOE report published in 2012, gives average values over three years between 1992 and 2012 for several types, each of the values grouping reactors with different power levels [1]. In spite of these differences, the overall trend observable during recent years, and for all of the reactors taken into account, is a steady decrease in the annual collective dose. The quasi-constant difference between the doses for PWR and BWR reactors can be noted. The PHWR-type (CANDU) reactors are nevertheless the exception, as a slight increase has been noted for them since 1996–1998.
This overall trend toward a decrease in the collective dose worldwide is due to several factors, among which are reinforced regulations, technological progress, improvements in facility design and in water chemistry, in operation preparation and procedures, team involvement, and of course data and lessons learned shared at the international scale [7].
According to the ISOE reports for the period 2010–2012, the trends per reactor type [1], independent of their respective power levels, are as follows:
-
a PWR reactor has an average collective dose of 0.60 man·Sv/year varying between 0.32 and 0.88 man·Sv/year;
-
a BWR reactor has an average collective dose of 1.12 man·Sv/year varying between 0.43 and 3.37 man·Sv/year;
-
a CANDU/PHWR reactor has an average collective dose assessed to be around 1.34 man·Sv/year varying between 0.35 and 2.59 man·Sv/year.
The graphite-gas type reactors (gas-cooled reactors, or GCRs), mostly operated in the United Kingdom, give the lowest average collective dose, i.e. 0.06 man·Sv/year (note that GCRs have a power level of between 475 and 610 MWe [8]).
Apart from the marked reactor type effect grouping reactors with different power levels, numerous different factors may cause the disparities found between different countries and sites as concerns exposure to ionizing radiation.
In spite of on-going efforts focusing on good practices, optimizations, and organization, etc., these figures tend toward asymptotic values in the different countries. If this trend is confirmed, further decreases can be logically expected for tomorrow's reactors through continuing design enhancements.
4 Evolution of the French PWR fleet
Like the different reactor fleets elsewhere in the world, the collective dose for the French reactor fleet has considerably decreased since the 1990s, as a result of progress made in operating conditions, optimizations, source term reduction, work organization, etc. [9] (see Fig. 5). Since 2007, the collective dose has stabilized, varying depending on the type and the number of unit downtimes [10].
Figure 6 highlights the differences as well as the progress made for each power level (900, 1300 and 1450 MW) between 1979 and 2009. Looking at the year 2009, the average collective dose for the entire reactor fleet was 0.69 man·Sv/year/reactor. Focusing on the thirty-four 900 MWe power level reactors, the average dose was 0.79 man·Sv/year/reactor. In the case of the 24 reactors in the 1300 and 1450 MWe power group, the average collective dose was 0.57 man·Sv/year/reactor at that time [1]. The less powerful reactors find advantage in such a direct comparison. Weighting based on the electrical power would show even greater differences.
In the case of the EPR, a radiation protection optimization approach was set up right from the reactor design phase, based on experience and lessons learned from already-commissioned reactors [14]. The annual collective dose objective is 0.35 man·Sv [14].
5 SFRs – overview
Here, the focus is more specifically on SFR, the reference reactor type for 4th generation reactors. In this case, external doses have different causes: activated corrosion products (mainly 54Mn1 and 60Co2) deposited on the primary circuit components (pumps, exchangers), the activation of the sodium and of its impurities, fission products if cladding ruptures, and tritium produced by ternary fission reaction and by boron activation.
The SFR type of reactor had not been taken into account in the comparative analyses published by the ISOE. Different documents were therefore compiled and analyzed to make up for this lack of data. The collective dose for the seven reactors, whose main features are noted in Table 1, was examined. This is therefore the first overview based on data published over a long period and coming from different organizations, without specific information as to the methodology employed. Nevertheless, this analysis has the advantage of giving a first general summary enabling general trends to be extrapolated.
With the exception of the BN 600 reactor (Russia), which reported higher values, the collective dose for SFRs was less than 0.4 man·Sv/year. The data for the BN 600 reactor vary widely with figures between 0.5 and 1.9 man·Sv/year for the period 1980–2001, according to reference [21] (2004 data, see Fig. 7).
After 2005, the values seem to indicate a downward trend, with a collective dose of 0.48 man·Sv/year in 2013 [22] (2014 data, see Fig. 7). It should be noted that the doses recorded between 2000 and 2003 do not seem to fit those of reference [21]. Therefore these data need to be checked and consolidated. Even if the last decade has seen improvements in certain practices which have enabled results closer to those of other reactors, the values reported for BN 600 remain considerably higher than those of other facilities of the same type. The reasons for these differences have not yet been analyzed (Fig. 8).
Among the differences found for the SFR and considered here, it can be noted that the FBTR and FFTF reactors are designed with loops, i.e. their primary pumps and intermediate heat exchangers are located outside the vessel, and are linked to it by primary pipe lines (see Fig. 9). The other reactors have these components (primary pumps, intermediate heat exchangers) integrated within the main vessel. Even if the loop reactor designs should a priori give higher dose, the lack of information and data available means a final assessment cannot be made at present.
With the exception of the values concerning the BN 600 reactor, it can be seen that the highest values have been recorded for the PFR reactor, for which numerous manual interventions have been necessary. The lowest values were obtained for the Superphénix reactor, with collective dose varying between 0.01 and 0.03 man·Sv/year, with no noticeable differences between the shutdown periods and 1986, the year in which the reactor was connected to the power grid for a total of 245 days [23].
In the case of the Phénix reactor, the accumulated collective dose recorded was 2.3 man·Sv over a period of 35 years, i.e. an annual average of 0.065 man·Sv/year (see Fig. 10).
The more or less marked variations recorded between 1974 and 2009 were due to exceptional operations which led to a maximum collective dose of 0.16 man·Sv/year.
These operations involved special repairs for major components (pumps/exchangers, etc.) or renovation and inspection work sites (for example, concerning vessel internal structures in 1999). It is interesting to note that when the reactor was functioning “normally”, the dose tended to be between 0.02 and 0.04 man·Sv/year.
Sodium-cooled fast reactors taken into account.
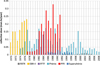 |
Fig. 8 Collective dose for different SFRs. |
6 Comparative analysis of PWRs and SFRs
Several collective doses for different types of reactors have been presented in the previous chapters. Data are focused on operating time. Some differences between these reactors can be noticed: some are in operation (mostly PWR) or under construction (for example EPR) and others were shut down. Their power and the number of operating years also vary. In spite of these different contexts (time, operation), collective doses have been collected in order to analyze orders of magnitude and trends lacking detailed publication comparing PWRs' and SFRs' radiation exposure impact.
The orders of magnitude for the collective dose concerning the PWR and SFR reactor types differ, with a lower dose for the SFRs (by a factor of 10 between the Phénix reactor and the average for the PWRs). This difference has a number of causes. For the PWRs, the operations leading to the greatest ionizing radiation exposures (representing more than 50% of the collective dose [14]) concern the cooling systems, the works involving opening/closing the reactor vessel, the preparation of inspections on the steam generators, the primary and auxiliary circuit valves, the interventions concerning the fuels, logistics and radioactive waste conditioning.
In the case of SFRs, some of the above activities do not exist or do not have the same impact. For example, opening the vessel with liquid sodium could not be envisaged, given the chemical reactivity of this element. Handling fuel assemblies is therefore carried out under the reactor concrete slab, thus ensuring biological protection for the personnel. Components are handled using covers which give radiation protection. Moreover the low activity of the secondary circuit, in particular in a pool-type reactor like Phénix and Superphénix, enables access to the secondary circuits without radiological constraints. Interventions concerning the valves or the steam generators are thus simplified and safer. To ensure such a low radioactivity, biological shields surround the core and even the lower parts of the heat exchangers (borated bottom) [18]. This type of reactor design therefore has potential for collective dose reductions compared to the PWRs/BWRs.
To maintain this potential advantage in terms of radiation protection, the design of future SFR reactors will need to integrate a certain number of options enabling dose minimization right from the earliest phases: pool-type design with the intermediate heat exchangers located within the main vessel, non-activated secondary circuits, tritium trapping in cold traps, remote handling in liquid sodium, cleaning pits enabling component decontamination, etc.
In the study described here, the comparison is limited to reactor operation. The deployment of SFRs has consequences throughout the nuclear cycle. For example, these reactors use special fuel assemblies in which natural uranium is no longer necessary. The impact on collective doses for the nuclear industry personnel should thus also be evaluated even if, in the case of today's nuclear industry, the dose contribution from reactors dominates, representing approximately 70% of the total [7].
7 Conclusion
A few publications compile data on collective doses for SFRs during operating time. It was interesting to collect several international and available results in order to compare their order of magnitude with collective doses for other types of reactors in spite of the differences (number of reactors, power, years of operation, regulations, etc.).
Since the 1990s, a decrease in the collective doses for nuclear industry personnel has been measured for water-cooled reactors, thanks to on-going improvements in operation practices and in changes to reactor designs. This trend can be expected to continue with 3rd generation reactors like the EPR under construction.
SFRs have design advantages which should, if respected, enable them to further improve collective doses during the facilities' operation.
References
- Information System on Occupational Exposure, Annual reports from 2003 to 2012, http://www.isoe-network.net/index.php/component/docman/cat_view/121-annual-reports.html [Google Scholar]
- ISOE Country Report, 2013, http://www.isoe-network.net/index.php/publications-mainmenu-88/annual-country-reports.html [Google Scholar]
- Organisation for Economic Co-operation and Development, Radiation Protection Aspects of Primary Water Chemistry and Source-Term Management Report, NEA/CRPPH/R(2014)2 [Google Scholar]
- A. Tigeras et al., Actions préventives en matière de chimie pour maîtriser le terme “source” et diminuer la dose aux travailleurs dans les centrales nucléaires d'EDF, Radioprotection 44, 153 (2009) [CrossRef] [EDP Sciences] [Google Scholar]
- IRSN, Le point de vue de l'IRSN sur la sûreté et la radioprotection du parc électronucléaire français, Rapport n° IRSN/DG/2014-00001, 2013 [Google Scholar]
- EDF, Rapport de l'Inspecteur Général pour la Sûreté Nucléaire et la Radioprotection, 2013 [Google Scholar]
- United Nations Scientific Committee on the Effects of Atomic Radiations, Sources and effects of ionizing radiation (UNSCEAR, New York, 2010) [Google Scholar]
- CEA, ELECNUC, Les centrales nucléaires dans le monde, 2015 [Google Scholar]
- G. Cordier, Optimization of activities and ALARA project at EDF, in 3rd SFRP Days on the Optimization of Radiation Protection in the Electronuclear, Industrial and Medical Fields, June 2002 (2002) [Google Scholar]
- EDF, Rapport de l'Inspecteur Général pour la Sûreté Nucléaire et la Radioprotection, 2015 [Google Scholar]
- ASN, Rapport sur l'état de la sûreté nucléaire et de la radioprotection en France, 2012 [Google Scholar]
- ASN, Rapport sur l'état de la sûreté nucléaire et de la radioprotection en France, 2014 [Google Scholar]
- G. Ranchoux et al., EDF measurement program for source term reduction, in 2010 ISOE International Symposium, Cambridge, United Kingdom, 17–19 November 2010 (2010) [Google Scholar]
- E. Arial et al., La radioprotection sur EPR : présentation comparée des instructions françaises et finlandaises et des démarches d'optimisation à la conception, Radioprotection 45, 477 (2010) [CrossRef] [EDP Sciences] [Google Scholar]
- V. Meenakshisundaram, Radiation protection aspects gained from the operation of FBTR. Basis for approach and criteria for future LMFBRs, in Proceedings of IRPA12 (International Radiation Protection Association) (2010), ISBN 978-92-105410-4 [Google Scholar]
- S.R. Adams, Theory, Design and Operation of Liquid Metal Fast Breeder Reactors including Operational Health Physics, NUREG/CR-4375, 1985 [CrossRef] [Google Scholar]
- W.L. Bunch, A decade of radiological shielding experience at the Fast Flux Test Facility, in ANS Winter Meeting, Washington, D.C., November 1990 (1990) [Google Scholar]
- J. Guidez, Phénix – Le retour d'expérience (EDP Sciences, Les Ullis, France, 2013) [Google Scholar]
- C.V. Gregory, A review of the operation of the Prototype Fast Reactor, Nucl. Energy 31, 173 (1992) [Google Scholar]
- A.M. Broomfield, Operating experience from the Prototype Fast Reactor, in Proceedings of an IAEA Symposium – “Fast Breeder Reactors: Experience And Trends” (1985), Vol. 1, pp. 187–202 [Google Scholar]
- N.N. Oshkanov, Experience in operating the BN-600 unit at the Belyi Yar Nuclear Power Plant, At. Energy 96 315 (2004) [CrossRef] [Google Scholar]
- M.V. Bakanov, Solution of scientific and technical problems related to operation of FNR-from BN-600 to BN-800, in Ninth International Scientific and Technical Conference “Safety, Efficiency and Economics of Nuclear Power Industry” (MNTK-2014), Moscow, May 2014 (2014) [Google Scholar]
- J. Guidez, G. Prele, Superphénix – Les acquis techniques et scientifiques (EDP Sciences, Les Ullis, France, 2016) [Google Scholar]
- CEA, Sodium-Cooled Nuclear Reactors, A Nuclear Energy Division Monograph (Editions du Moniteur, Paris, France, 2016) [Google Scholar]
Produced by the activation of iron coming from the structures.
Produced by the activation of impurities present in certain components.
Cite this article as: Joel Guidez, Anne Saturnin, Evolution of the collective radiation dose of nuclear reactors from the 2nd through to the 3rd generation and 4th generation sodium-cooled fast reactors, EPJ Nuclear Sci. Technol. 3, 32 (2017)
All Tables
All Figures
|
Fig. 1 Main contributors to doses coming from surface contamination by activated corrosion products [4]. |
| In the text | |
|
Fig. 2 Distribution of the French reactor fleet collective doses for shutdown and operational phases [1]. |
| In the text | |
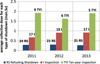 |
Fig. 3 Average collective doses for the French reactor fleet by type of unit shutdown [6]. |
| In the text | |
 |
Fig. 4 Annual collective dose by type of reactor [1]. |
| In the text | |
 |
Fig. 5 Average annual collective dose per reactor in the French fleet [10–12]. |
| In the text | |
 |
Fig. 6 Average annual collective dose by reactor type in the French fleet (from [13]). |
| In the text | |
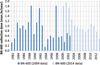 |
Fig. 7 Evolution of the collective dose for the BN 600 reactor between 1982 and 2013 [21,22]. |
| In the text | |
|
Fig. 8 Collective dose for different SFRs. |
| In the text | |
 |
Fig. 9 Functional diagram of the pool-type/loop-type design nuclear supply system [24]. |
| In the text | |
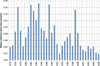 |
Fig. 10 Annual collective doses during Phénix operational period [18]. |
| In the text | |
Current usage metrics show cumulative count of Article Views (full-text article views including HTML views, PDF and ePub downloads, according to the available data) and Abstracts Views on Vision4Press platform.
Data correspond to usage on the plateform after 2015. The current usage metrics is available 48-96 hours after online publication and is updated daily on week days.
Initial download of the metrics may take a while.